“We’re running guys.” Hundreds of people are evacuating after huge eruptions from Indonesia’s Mount Ruang volcano. The falling ash and debris temporarily shut down an international airport, watch this video to see why there was a tsunami alert.
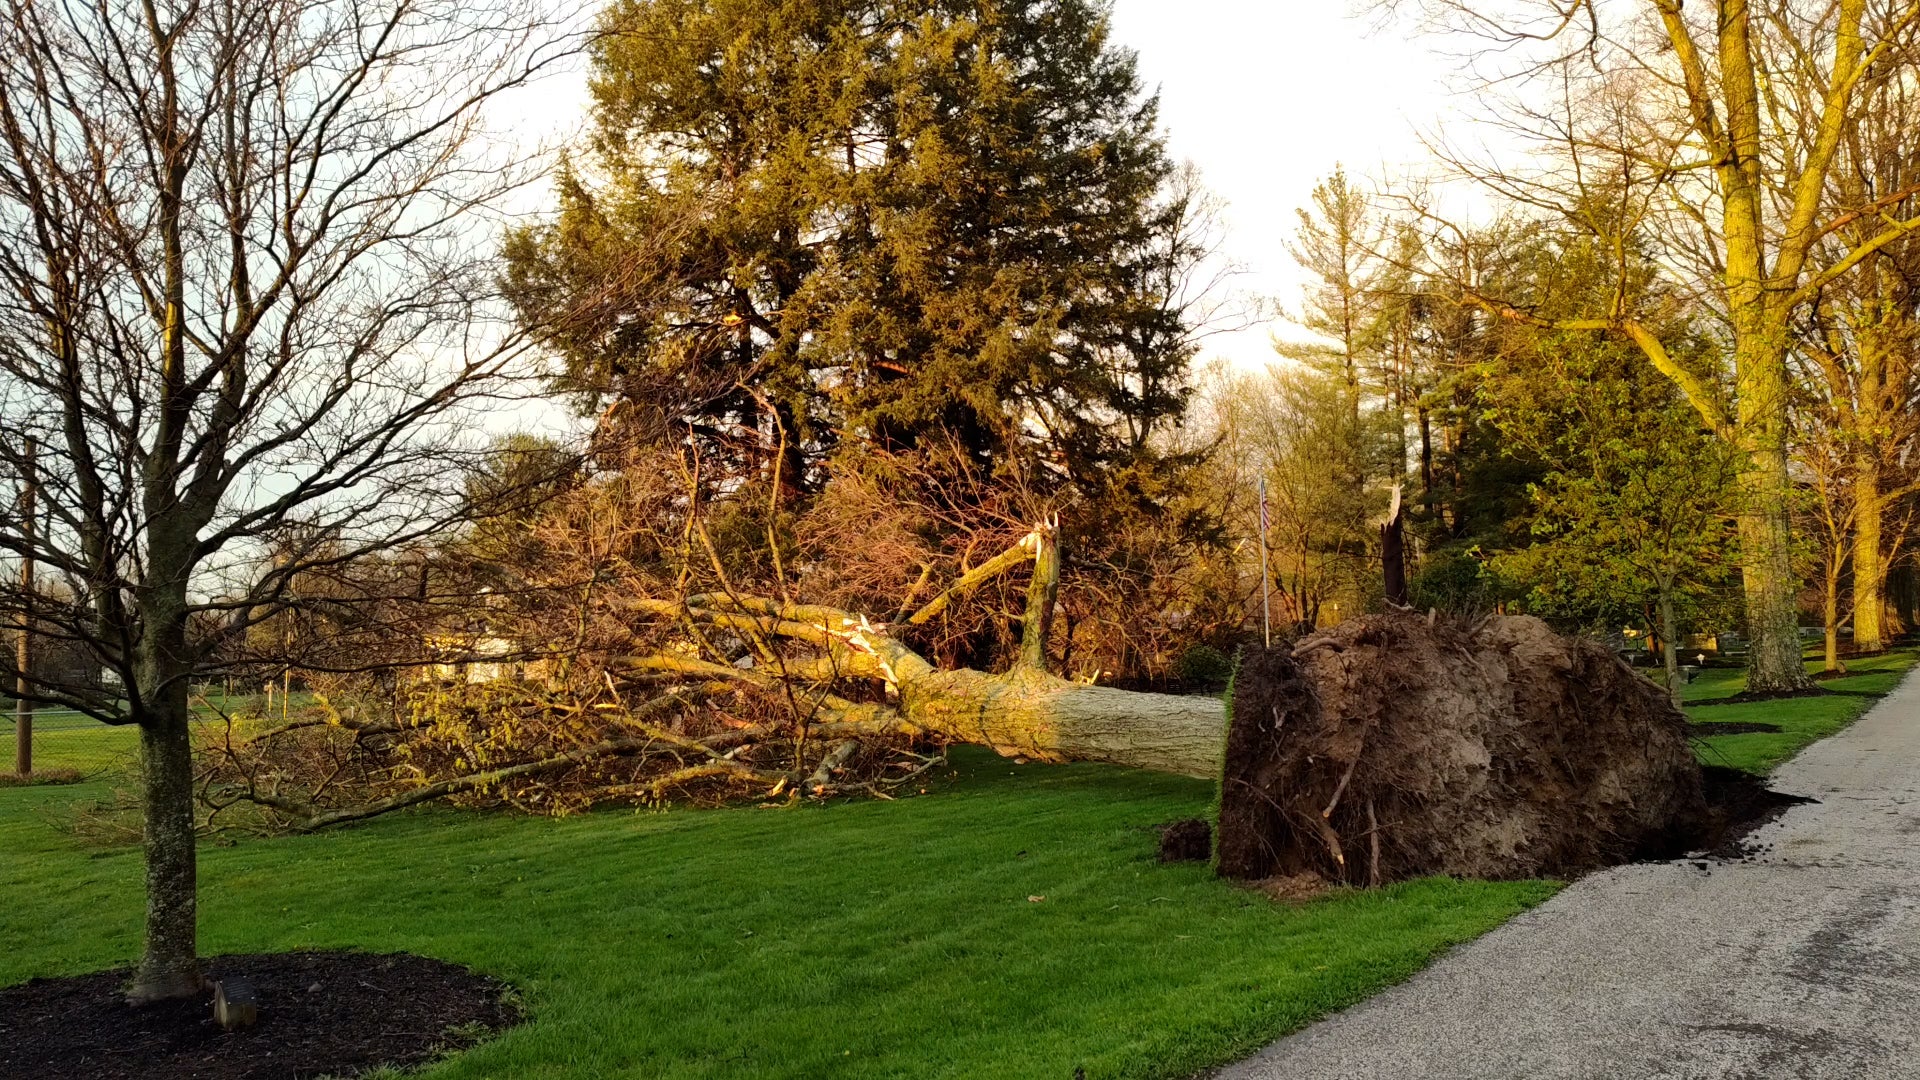
A round of severe thunderstorms crossing the Midwest left behind serious damage in some places. Homes and outbuildings were crushed or ripped apart by powerful winds, possibly from tornadoes. Take a look at the damage.